To convey a concrete feeling of how httperf is used, this section presents a brief example of how to measure the request throughput of a web server. The simplest way to achieve this is to send requests to the server at a fixed rate and to measure the rate at which replies arrive. Running the test several times and with monotonically increasing request rates, one would expect to see the reply rate level off when the server becomes saturated, i.e., when it is operating at its full capacity.
To execute such a test, it is necessary to invoke httperf on the
client machines. Ideally, the tool should be invoked simultaneously
on all clients, but as long as the test runs for several minutes,
startup differences in the range of seconds do not cause significant
errors in the end result. A sample command line is shown below:
  httperf --server hostname \
   --port 80 --uri /test.html \
   --rate 150 --num-conn 27000 \
   --num-call 1 --timeout 5
This command causes httperf to use the web server on the host with IP
name hostname, running at port 80. The web page being
retrieved is ``/test.html'' and, in this simple test, the
same page is retrieved repeatedly. The rate at which requests are
issued is 150 per second. The test involves initiating a total of
27,000 TCP connections and on each connection one HTTP call is
performed (a call consists of sending a request and receiving a
reply). The timeout option selects the number of seconds that the
client is willing to wait to hear back from the server. If this
timeout expires, the tool considers the corresponding call to have
failed. Note that with a total of 27,000 connections and a rate of
150 per second, the total test duration will be approximately 180
seconds, independent of what load the server can actually sustain.
Total: connections 27000 requests 26701 replies 26701 test-duration 179.996 s

Connection rate: 150.0 conn/s (6.7 ms/conn, <=47 concurrent connections)
Connection time [ms]: min 1.1 avg 5.0 max 315.0 median 2.5 stddev 13.0
Connection time [ms]: connect 0.3

Request rate: 148.3 req/s (6.7 ms/req)
Request size [B]: 72.0

Reply rate [replies/s]: min 139.8 avg 148.3 max 150.3 stddev 2.7 (36 samples)
Reply time [ms]: response 4.6 transfer 0.0
Reply size [B]: header 222.0 content 1024.0 footer 0.0 (total 1246.0)
Reply status: 1xx=0 2xx=26701 3xx=0 4xx=0 5xx=0

CPU time [s]: user 55.31 system 124.41 (user 30.7% system 69.1% total 99.8%)
Net I/O: 190.9 KB/s (1.6*10^6 bps)

Errors: total 299 client-timo 299 socket-timo 0 connrefused 0 connreset 0
Errors: fd-unavail 0 addrunavail 0 ftab-full 0 other 0

Once a test finishes, several statistics are printed. An example output of httperf is shown in Figure 1. The figure shows that there are six groups of statistics, separated by blank lines. The groups consist of overall results, results pertaining to the TCP connections, results for the requests that were sent, results for the replies that were received, CPU and network utilization figures, as well as a summary of the errors that occurred (timeout errors are common when the server is overloaded).
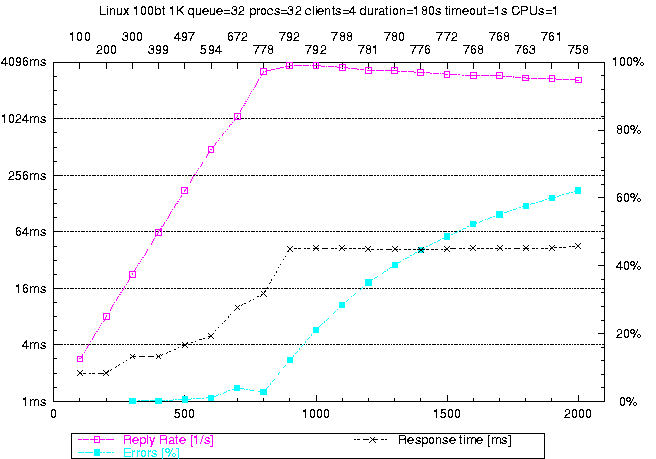
A typical performance graph that can be obtained with the statistics reported by httperf is shown in Figure 2. For this particular example, the server consisted of Apache 1.3b2 running on a HP NetServer with one 200MHz P6 processor. The server OS was Linux v2.1.86. The network consisted of a 100baseT Ethernet and there were four client machines running HP-UX 10.20. As the top-most graph shows, the achieved throughput increases linearly with offered load until the server starts to become saturated at a load of 800 calls per second. As offered load is increased beyond that point, server throughput starts to fall off slightly as an increasing amount of time is spent in the kernel to handle network packets for calls that will fail eventually (due to client timeouts). This is also reflected in the error graph, which shows the percentage of calls that failed: once the server is saturated, the number of calls that fail increases quickly as more and more calls experience excessive delays. The third and final graph in the figure shows the average response time for successful calls. The graph shows that response time starts out at about 2ms and then gradually increases until the server becomes saturated. Beyond that point, response time for successful calls remains largely constant at 43ms per call.