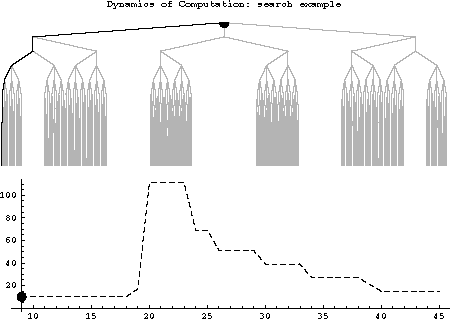
Changes in search trees and search cost with the addition of new constraints for a graph coloring search problem. In the search trees, black lines show paths explored to find the first solution or determine there are no solutions. Gray lines show additional consistent paths that would need to be explored to find all solutions. The lower plot shows the search cost as a function of the number of edges in the graph: the black point corresponds to the currently displayed search tree. The peak in the cost occurs just as the last solution is eliminated.
A detailed discussion of this search example is available in Tad Hogg, Bernardo A. Huberman and Colin Williams, Phase Transitions and the Search Problem, Artificial Intelligence 81, 1-15 (1996).